

IvorySQL Multimodal in Practice: 7 Pitfalls Before Running pg_textsearch + pgvector in Production
Part two of the enterprise knowledge-base multimodal series: hands-on testing of pg_textsearch + pgvector hybrid retrieval on IvorySQL 5.4, reproducing and dissecting the seven pitfalls you hit before going to production, with full SQL scripts and reproduction steps.
Wei Bo
Deputy Secretary-General
This article is Part Two of the Enterprise Intelligent Knowledge Base Multimodal Series: Troubleshooting Multimodal Retrieval in Production, a sequel to the IvorySQL multimodal in practice series. It is based on IvorySQL 5.4 (kernel PostgreSQL 18.4), with the full set of tests completed in a standardized container environment on Windows 11 + Docker Desktop. All verification was carried out on the latest stable combination of pg_textsearch 1.4.0 and pgvector 0.8.5; all 7 categories of core problems were successfully reproduced, the 8 accompanying SQL scripts and 9 measured screenshots can all be traced and re-run, and dynamically fluctuating data has been annotated item by item, ensuring the content is authentic, trustworthy, actionable, and reproducible.
Unlike a conventional technical review, the previous article verified whether multiple extensions can coexist and work together; this article focuses on the core pain points of production deployment, serving as a pre-production troubleshooting checklist. It confronts the various hidden pitfalls in pg_textsearch plus vector hybrid retrieval scenarios, breaks down the root causes, offers actionable fixes, and answers the question developers and operators really care about: "dare I take this straight to production?"
0. Four Things to Get Straight First
0.1 The Version Baseline for This Article
| Item | Value |
|---|---|
| Database | IvorySQL 5.4 (kernel PostgreSQL 18.4) |
| Container | ivorysql-ts140, port 5436 (see Appendix C, one command to start) |
| pgvector | 0.8.5 (HNSW) |
| pg_textsearch | 1.4.0 (latest upstream stable GA; 1.0.0 officially released in 2026-03) |
| Dataset | 12 short PostgreSQL operations articles (kb_pgops table, 384-dimensional vectors, full list in 0.4) |
0.2 A Few Words About Versions
The previous article in this series (Part One, already published) ran its experiments on pg_textsearch 0.6.1 (a prerelease)—at the time the version in my Dockerfile had not been updated along with upstream. This article re-ran all experiments on 1.4.0, with two results:
-
BM25 retrieval behavior is bit-for-bit identical across the two versions—the Top5 of all 5 queries and the scores to four decimal places are the same. What this means for you in practice: if a production database is upgraded from 0.6.1 to 1.4.0, retrieval results will not change, and existing evaluation conclusions need not be overturned and re-run.
-
One pitfall has been fixed in the new version: the silent failure on 0.6.1 where "the index looks alive but queries return 0 rows" could not be reproduced on 1.4.0 even after two consecutive restarts. That pitfall has not been deleted from the article; instead it was moved to "Appendix D" at the end—it is itself the best evidence for "why upgrade".
The remaining 7 pitfalls all still hold when measured on 1.4.0. Most of their roots lie not in pg_textsearch itself but in PostgreSQL's planner, tokenizer, and deployment approach—which is also why they are unlikely to be "fixed in passing" by a version upgrade.
0.3 The Seven Pitfalls at a Glance
| # | Pitfall | Symptom (what you will see) | One-line fix |
|---|---|---|---|
| 1 | Multimodal extensions must be installed yourself, and reversing the order keeps the database from starting | CREATE EXTENSION reports could not access file; change preloading before the files are in place and the database goes on FATAL strike | Drop in the .so → then edit preloading → finally restart; the order cannot be shuffled |
| 2 | The simple configuration has "zero lexemes" for Chinese | Chinese-only queries always return 0 rows | Switch to zhparser / pg_jieba / pg_bigm |
| 3 | One scalar subquery makes the HNSW index a wasted build | An InitPlan shows up in the plan, degrading to Seq Scan + Sort | Pass the vector in as the bind parameter $1::vector |
| 4 | w=1 does not mean a BM25 index scan | The ranking shows [2,3,4,5,1]—rows that "should not be there" | Explicitly filter out zero-score candidates in the CTE |
| 5 | HNSW built, yet a Seq Scan is used | idx_scan = 0 | The planner is saving money, not a broken index |
| 6 | HNSW maintenance and capacity | Wanting to change dimensions, VACUUM INDEX errors, disk underestimated | A dimension change always requires a rebuild; size capacity by measured bytes per row |
| 7 | Nothing to look at after go-live | pg_stat_statements is present but not enabled; dead tuples quietly pile up | Enable via preload + threshold-based inspection |
Every pitfall follows the same structure: symptom → root cause → fix → verification → remember one line. If you are firefighting, jump straight to "Fix"; if you want to avoid pitfalls systematically, read from the beginning—about 20 minutes.
Let us be clear about who owns these pitfalls. Among the 7, Pitfall 1 is a deployment-order problem (place the extension files first or edit preloading first); Pitfall 2 (tokenizer), Pitfall 3 (planner), Pitfall 5 (cost estimation), and Pitfall 7 (statistics views) come from general mechanisms in the PostgreSQL kernel; Pitfalls 4 and 6 come from the implementations of ecosystem extensions such as pg_textsearch / pgvector—switch to any PostgreSQL-family database and not one of these pitfalls can be avoided; they are not problems unique to IvorySQL. Conversely, precisely because IvorySQL is fully compatible with the PostgreSQL extension ecosystem (both extensions in this article compiled cleanly on 5.4 on the first try), the troubleshooting experience the PG ecosystem has accumulated over the years can be reused directly here—that is the dividend of compatibility, not a burden.
0.4 The Experiment Table, Test Document Set, and Two Indexes: Meet the Names That Keep Coming Back
The kb_pgops table, the 12 test documents, and the three indexes that recur throughout this article are all created in one shot by code/kb_pgops_init.sql in step ③ of Appendix C (create the table, then build the two indexes, and finally load the 12 rows), and all later experiments reuse them directly. First, the table DDL:
CREATE TABLE kb_pgops (
    id SERIAL PRIMARY KEY,          -- the primary key index kb_pgops_pkey (btree) is created automatically by this line
    title VARCHAR(300),
    content TEXT,
    category VARCHAR(50),
    embedding vector(384),          -- 384-dimensional vector column, depends on pgvector
    created_at TIMESTAMP DEFAULT CURRENT_TIMESTAMP
);
The 12 documents loaded in are the following set of short PostgreSQL operations articles (each body is 180–220 characters, full text in code/kb_pgops_init.sql; the categories deliberately cover different facets of operations so that "exact keyword hits" and "similar topic but different wording" pull apart from each other):
| id | Category | Title |
|---|---|---|
| 1 | Backup & Recovery | pg_dump logical backup and restore |
| 2 | Index Maintenance | B-tree index maintenance and REINDEX |
| 3 | VACUUM | VACUUM and autovacuum tuning |
| 4 | Monitoring | Locating slow queries with pg_stat_statements |
| 5 | Locks | Lock waits and deadlock troubleshooting |
| 6 | Replication | Streaming replication and primary/standby failover |
| 7 | Backup & Recovery | WAL archiving and PITR point-in-time recovery |
| 8 | Parameter Tuning | shared_buffers and memory tuning |
| 9 | Partitioning | pg_partman time-series partitioning |
| 10 | Query Plans | Reading EXPLAIN ANALYZE query plans |
| 11 | Parameter Tuning | checkpoint and bgwriter tuning |
| 12 | Security | pg_hba.conf connection authentication security |
The 384-dimensional vectors in the embedding column are not semantic vectors generated by a large model; they are reproducible pseudo-vectors assembled by the dataset generation script via token-hash (MD5, fixed seed=42) after tokenizing the documents, and already hard-coded row by row in kb_pgops_init.sql. This keeps the experiment free of external dependencies—no model service is needed, and anyone re-running it gets the same set of numbers. The trade-off is that they have no real semantic generalization ability, so this article only demonstrates mechanisms and does not evaluate retrieval capability (this boundary is fully declared in Appendix A.1; for serious evaluation, switch to an external standard dataset).
The 5 accompanying test queries (Pitfall 4 and Appendix A reference Q1–Q5 repeatedly; gold = human-annotated "which ids should be hit"):
| Query | Query terms | gold | Design intent |
|---|---|---|---|
| Q1 | pg_dump backup | [1] | Exact terminology, BM25's strength |
| Q2 | backup WAL archiving recovery (mixed Chinese and English) | [1, 7, 6] | Broad semantics, cross-document |
| Q3 | REINDEX index performance | [2, 3, 10] | A mixed Chinese-English boundary case, the scene of Pitfall 4 |
| Q4 | pg_locks lock deadlock | [5] | Exact terminology |
| Q5 | checkpoint too frequent IO jitter—what should I do, and is it related to WAL archiving and primary/standby failover | [11] | Asks several sub-topics at once, a test of ranking |
The two indexes are built on the body column and the vector column respectively:
-- Full-text search index (the star of Pitfalls 2 and 4 and Appendix D); the bm25 access method comes from pg_textsearch
CREATE INDEX kb_pgops_bm25_idx ON kb_pgops USING bm25(content) WITH (text_config='simple');

-- Approximate vector search index (the star of Pitfalls 3, 5, and 6); the hnsw access method comes from pgvector
CREATE INDEX kb_pgops_hnsw_idx ON kb_pgops USING hnsw (embedding vector_cosine_ops)
    WITH (m = 16, ef_construction = 64);
| Index name | Access method | Source | Purpose |
|---|---|---|---|
| kb_pgops_pkey | btree | Created automatically by the primary key | Fetch rows by id (Pitfall 3's InitPlan uses this one) |
| kb_pgops_bm25_idx | bm25 | The 1st CREATE INDEX above | Keyword full-text search |
| kb_pgops_hnsw_idx | hnsw | The 2nd CREATE INDEX above | Vector similarity search |
Once the three indexes are built, running the following psql meta-command confirms they are all there in one shot (the complete output including access method and size is shown in Figure 8; Pitfall 6 also uses the same command to measure index size). As for "does a pkey appearing in the plan mean HNSW was used?", that can only be explained together with the execution plan, so it is left to Pitfall 3.
docker exec ivorysql-ts140 psql -U ivorysql -d ivorysql -p 5432 -c "\di+ kb_pgops*"
It should list 3 rows (measured output; for how size is measured see Figure 8):
Name        | Type  | Access method | Size
--------------------+-------+---------------+------
 kb_pgops_bm25_idx  | index | bm25          | 16 kB
 kb_pgops_hnsw_idx  | index | hnsw          | 32 kB
 kb_pgops_pkey      | index | btree         | 16 kB
1. Pitfall 1: Multimodal Extensions Must Be Installed Yourself, and the Wrong Install Order Keeps the Database from Starting
Symptom
The official IvorySQL image registry.highgo.com/ivorysql/ivorysql:5.4-ubi8 focuses on the database kernel and Oracle compatibility; multimodal extensions from the PostgreSQL ecosystem must be installed separately according to your own needs—this is consistent with how the official PostgreSQL image works (Part One of the series also verified this point). Installing pg_textsearch for the first time usually involves two steps.
Install first:
CREATE EXTENSION pg_textsearch;
ERROR:  could not access file "pg_textsearch": No such file or directory
Following PostgreSQL convention, you configure shared_preload_libraries and then restart—
FATAL: could not access file "pg_textsearch": No such file or directory
The database simply will not start—you cannot even connect with psql.
Root Cause
Two independent things stack on top of each other:
-
Extension files must be compiled into the filesystem first. This is not a shortcoming of IvorySQL but the trade-off of "keep the kernel lean, compose capabilities on demand"—and the upside is precisely that the extension version is ours to decide: this article used the latest upstream pg_textsearch 1.4.0 directly, with no need to be pinned to whatever fixed version ships in the image. Moreover, compiling and installing PG ecosystem extensions on IvorySQL 5.4 poses no obstacle at all; both pgvector and pg_textsearch in this article compiled cleanly on the first try (full Dockerfile in Appendix C).
-
shared_preload_libraries is a startup contract, not a wish list. This is a general PostgreSQL mechanism, unrelated to IvorySQL itself: at startup the database loads each library in the list one by one, and a single missing one brings the whole thing down—it will never "skip it and deal with it later".
So the essence of this pitfall is not "you have to install it yourself" but the order: write the preload entry before the files are in place, and the database immediately refuses to start.
A word on the version difference (and this time the praise goes to pg_textsearch upstream): back in 0.6.1 these two errors looked identical and offered no hint at all; 1.4.0 has made the first one considerably friendlier:
ERROR:  pg_textsearch library not loaded.
        Add pg_textsearch to shared_preload_libraries and restart.
It also throws in version-consistency checking (a mismatch between the library version and the SQL script version produces an explicit error). But the "must be preloaded" requirement itself has not changed—so the pitfall remains; the error just tells you directly what is missing and what to do.
Fix
The order cannot be shuffled; three steps:
# ① First, put the extension files into the filesystem (compile and install)
#    The minimal set installs just the two used in this article: pgvector + pg_textsearch
#    Full Dockerfile in Appendix C / 06_生产级部署_Dockerfile/

# ② Then edit the preload configuration (keep the existing entries, append the new one)
#    The first 3 entries right of the equals sign—gb18030_2022, liboracle_parser, ivorysql_ora—are the image's factory
#    originals (GB18030-2022 national character set, Oracle-compatible parser, Oracle compatibility layer, in order);
#    keep them as they are, do not delete; only append the 4th entry pg_textsearch at the end. Measured after the edit:
#    shared_preload_libraries = 'gb18030_2022, liboracle_parser, ivorysql_ora, pg_textsearch'

# ③ Finally, restart
docker restart ivorysql-ts140
Why stress "keep the existing entries": shared_preload_libraries is a full overwrite, not an incremental append—if you write only pg_textsearch, the first 3 factory libraries get squeezed out along with it, and IvorySQL's national character set and Oracle compatibility stop working. Before making changes you can run SHOW shared_preload_libraries; copy those 3 existing entries down verbatim, then append the new library at the end.
If it is already failing with FATAL: revert the configuration to its original values so the database starts → install the missing .so → then go through ①②③ again.
If you do not want to compile every time: bake the Dockerfile from Appendix C into your own base image—build once, and the team reuses it long-term. I also look forward to the community releasing image variants with multimodal extensions preinstalled, eliminating step ① entirely.
Verification
docker exec ivorysql-ts140 psql -U ivorysql -d ivorysql -p 5432 -c \
  "SELECT name, default_version, installed_version FROM pg_available_extensions WHERE name IN ('vector','pg_textsearch') ORDER BY name;" -c \
  "SHOW shared_preload_libraries;"
The first statement should return 2 extension records (only a non-empty installed_version means it is truly installed), and the second should show pg_textsearch in the preload list. If the first returns 0 rows = step ① was not done; if both extension rows are present but CREATE EXTENSION still fails = steps ② and ③ were skipped.
Measured in this article's container (Figure 1): both installed_version columns have values, meaning they are truly installed; pg_textsearch is also in the shared_preload_libraries preload list.
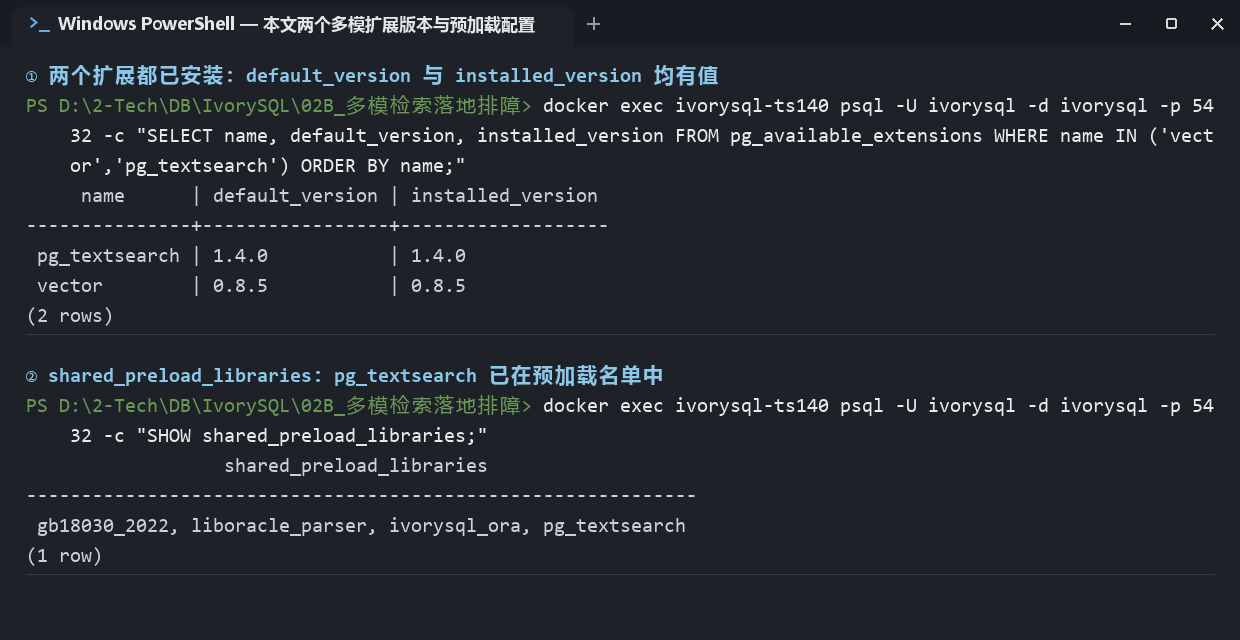
Figure 1: Measured extension versions and preload configuration (the first two items in sql/00_env_check.sql)
Remember One Line
shared_preload_libraries is a "startup contract"—any library written there must exist, otherwise the database would rather not start at all. This is a general PostgreSQL mechanism, unrelated to IvorySQL itself; having to install extensions yourself is not an IvorySQL shortcoming either, so do not assign the blame to the wrong place.
2. Pitfall 2: The simple Configuration Has "Zero Lexemes" for Chinese
Symptom
Run a Chinese-only query and the BM25 path always returns 0 rows—nothing matched. You might think the index is broken—in fact the index is perfectly fine; it simply never saw any Chinese from start to finish.
Root Cause
First, see for yourself what the index actually "sees":
docker exec ivorysql-ts140 psql -U ivorysql -d ivorysql -p 5432 -c \
  "SELECT to_tsvector('simple','pg_dump 逻辑备份与恢复') AS probe1;" -c \
  "SELECT to_tsvector('simple','逻辑备份与恢复') AS probe2;"
The measured output is shown in Figure 2: in the first statement not a single lexeme remains from the continuous Chinese string (only the two English tokens pg/dump are left); the second, pure Chinese, comes back empty.
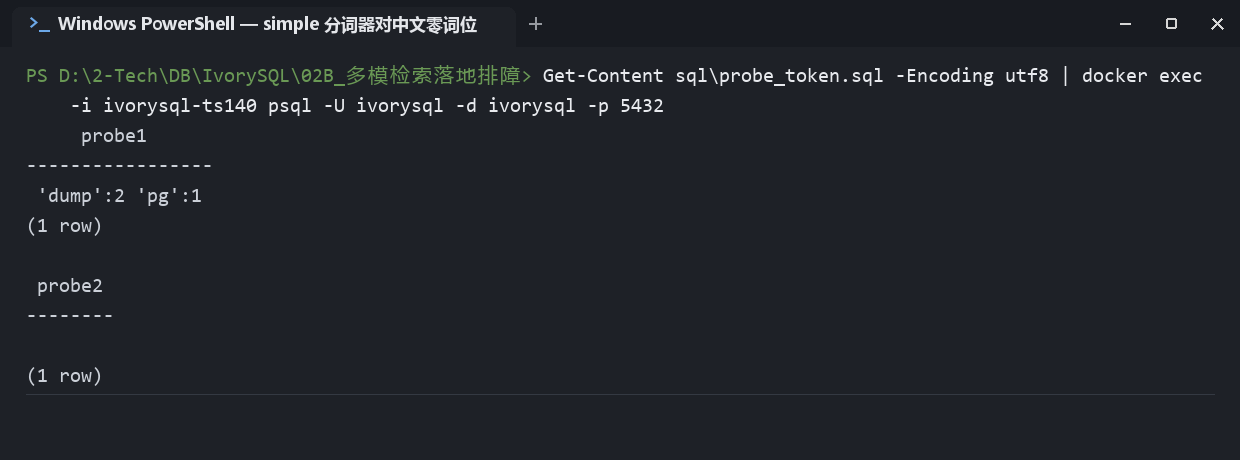
Figure 2: to_tsvector measured—mixed English leaves two lexemes, pure Chinese returns empty
Note: this is not "Chinese is segmented poorly"; it is that under this configuration no Chinese lexemes are produced at all. PostgreSQL full-text search works as "parser splits tokens → dictionary processes → configuration combines"; simple means "split only on whitespace/punctuation, no dictionary lookup"—English is naturally segmented by spaces so it suffices, while Chinese written continuously is wiped out entirely. This conclusion applies only to the simple configuration and does not mean "PostgreSQL cannot search Chinese".
One knock-on effect worth knowing: pg_dump gets split into the two words pg and dump. As a result, documents containing only pg (pg_partman, pg_locks) also get a BM25 score—which explains many later "why did this one match too?" moments.
Digging One Level Deeper: Why Chinese Is Not Even a Single Token
Switching to ts_debug to look at the parser's classification is far clearer than reading only to_tsvector output. Run this statement (output in the upper half of Figure 3 below):
docker exec ivorysql-ts140 psql -U ivorysql -d ivorysql -p 5432 -c \
  "SELECT alias, token, lexemes FROM ts_debug('simple','pg_dump 逻辑备份与恢复');"
In the result the entire Chinese stretch is classified as blank (non-word characters)—it is not "a word was split out but the dictionary does not recognize it"; it was never treated as a word at all (upper half of Figure 3: blank | 逻辑备份与恢复).
What decides "which characters count as a word" is the parser's character classification, which depends on the database encoding and lc_ctype. Measured values in this article's container (lower half of Figure 3):
docker exec ivorysql-ts140 psql -U ivorysql -d ivorysql -p 5432 -c \
  "SHOW server_encoding;" -c "SELECT datcollate, datctype FROM pg_database WHERE datname = current_database();"
Under the SQL_ASCII + C combination, Chinese characters are not recognized as letters and fall straight into blank, hence zero lexemes.
This SQL_ASCII + C setup was not configured by hand for this article; it is the cluster-level default from when the official IvorySQL image initializes the data cluster (initdb): even the template database template0, which is not allowed to be modified, is SQL_ASCII + C; the business database ivorysql did not explicitly specify an encoding and locale at creation, so it inherited the template verbatim. The reason zh_probe in the "Verification" section below is UTF8 is precisely that its creation explicitly wrote ENCODING 'UTF8' LC_CTYPE 'en_US.utf8'. To see the encoding provenance of every database in your own instance at a glance, run this statement:

docker exec ivorysql-ts140 psql -U ivorysql -d ivorysql -p 5432 -c \
  "SELECT datname, pg_encoding_to_char(encoding) AS enc, datcollate, datctype FROM pg_database ORDER BY 1;"
Measured in this article's container: the four rows template0, template1, postgres, and ivorysql are all SQL_ASCII | C | C, and only zh_probe—created with an explicitly specified encoding/locale—is UTF8 | en_US.utf8 | en_US.utf8. Every default database is without exception the same, which is direct evidence of "a cluster default, not hand-configured"; if those four rows are UTF8 in your instance, then the image or the database-creation step specified the encoding explicitly, and the Pitfall 2 phenomenon should be judged by your own query results.
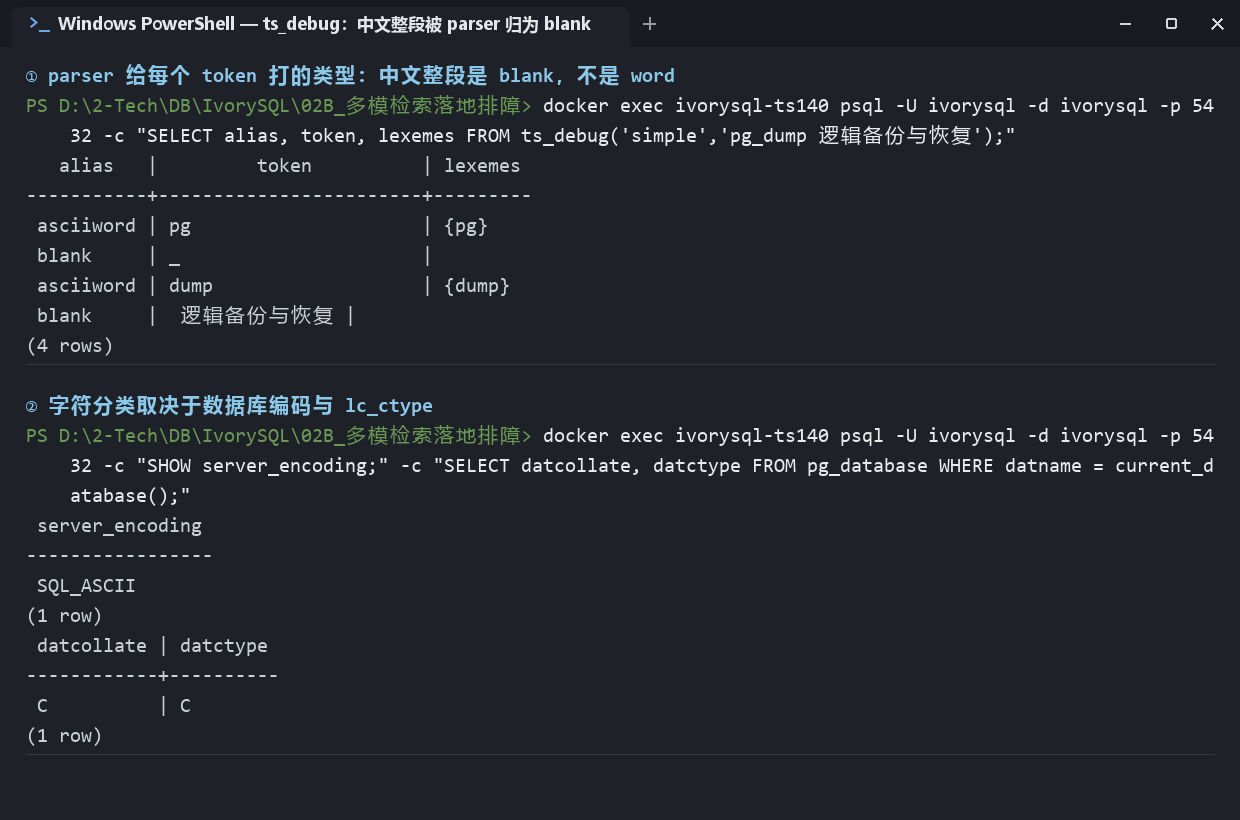
Figure 3: Pitfall 2 evidence—the parser labels the entire Chinese stretch as blank; SQL_ASCII + C is the environmental precondition for zero lexemes
So re-running in your own environment may show different behavior:
| Environment | Chinese behavior under simple |
|---|---|
| SQL_ASCII + C (this article's container, measured); the image's initdb cluster default, not hand-configured | The entire stretch falls into blank, zero lexemes |
| UTF-8 + C locale (inferred from the mechanism, not measured) | Most likely still zero lexemes |
| UTF-8 + en_US.utf8 locale (measured, in the auxiliary database zh_probe, see the "Verification" section) | Chinese becomes a word and is kept by the simple dictionary as a single lexeme for the whole string (measured '逻辑备份与恢复':1)—only an exactly equal whole string matches, so retrieval is still unusable, but the phenomenon is "one extremely long lexeme" rather than empty |
The three environments behave differently but the conclusion is the same: simple is unusable for Chinese. To find out which one you are in, do not guess—run the ts_debug statement above and look at the alias column.
Fix
Chinese corpora require a different tokenization approach; choose one of three (all mature options in the PG ecosystem):
| Option | Characteristics | Suitable for |
|---|---|---|
| zhparser | Based on scws, dictionary-based segmentation | General Chinese |
| pg_jieba | jieba segmentation | General Chinese, active community |
| pg_bigm | 2-gram, no dictionary needed | Many proper nouns and many new words (Part One of the series already verified it works) |
Rebuild the BM25 index after changing the configuration for the new lexemes to take effect.
Note (scope statement): the actual compilation, installation, and segmentation results of zhparser / pg_jieba were not individually measured in this article (they require compiling tokenizer engines such as SCWS); the selection guidance is as above—just implement it according to your corpus. Of the three, pg_bigm has already been verified as usable in Part One of the series. The "Verification" section below uses an auxiliary database with a different encoding in the same instance, proving the root cause (encoding/locale determines whether Chinese produces lexemes), not the segmentation quality of zhparser.
Verification
After changing the configuration, re-run the to_tsvector and ts_debug statements above: a Chinese string should produce non-empty lexemes, and the alias column of ts_debug should change from blank to word.
Installing zhparser / pg_jieba requires extra compilation, but you can verify on the spot without installing any extension: create a UTF8 + en_US.utf8 test database in the same instance (TEMPLATE template0, verified usable in this article's container)—same machine, same set of extensions, with only the encoding and lc_ctype changed, which is exactly the isolated test of the "environmental precondition" conclusion above:
docker exec ivorysql-ts140 psql -U ivorysql -d ivorysql -p 5432 -c "CREATE DATABASE zh_probe TEMPLATE template0 ENCODING 'UTF8' LC_COLLATE 'en_US.utf8' LC_CTYPE 'en_US.utf8';"

# Re-run the two probes (note: change -d to zh_probe)
docker exec ivorysql-ts140 psql -U ivorysql -d zh_probe -p 5432 -c \
  "SELECT to_tsvector('simple','pg_dump 逻辑备份与恢复') AS probe1;" -c \
  "SELECT to_tsvector('simple','逻辑备份与恢复') AS probe2;" -c \
  "SELECT alias, token, lexemes FROM ts_debug('simple','pg_dump 逻辑备份与恢复');"
Measured in this article's container: probe2 changes from empty to '逻辑备份与恢复':1, and in ts_debug the alias of the Chinese changes from blank to word with non-empty lexemes—Chinese now produces lexemes, which is the measured basis for the third row of the three-environment table above. Note also: the lexeme produced is the entire continuous string; the simple dictionary will not split "逻辑备份与恢复", so only an exactly equal whole string matches—real dictionary-based segmentation still requires an extension like zhparser. When you are done verifying, just run DROP DATABASE zh_probe;.
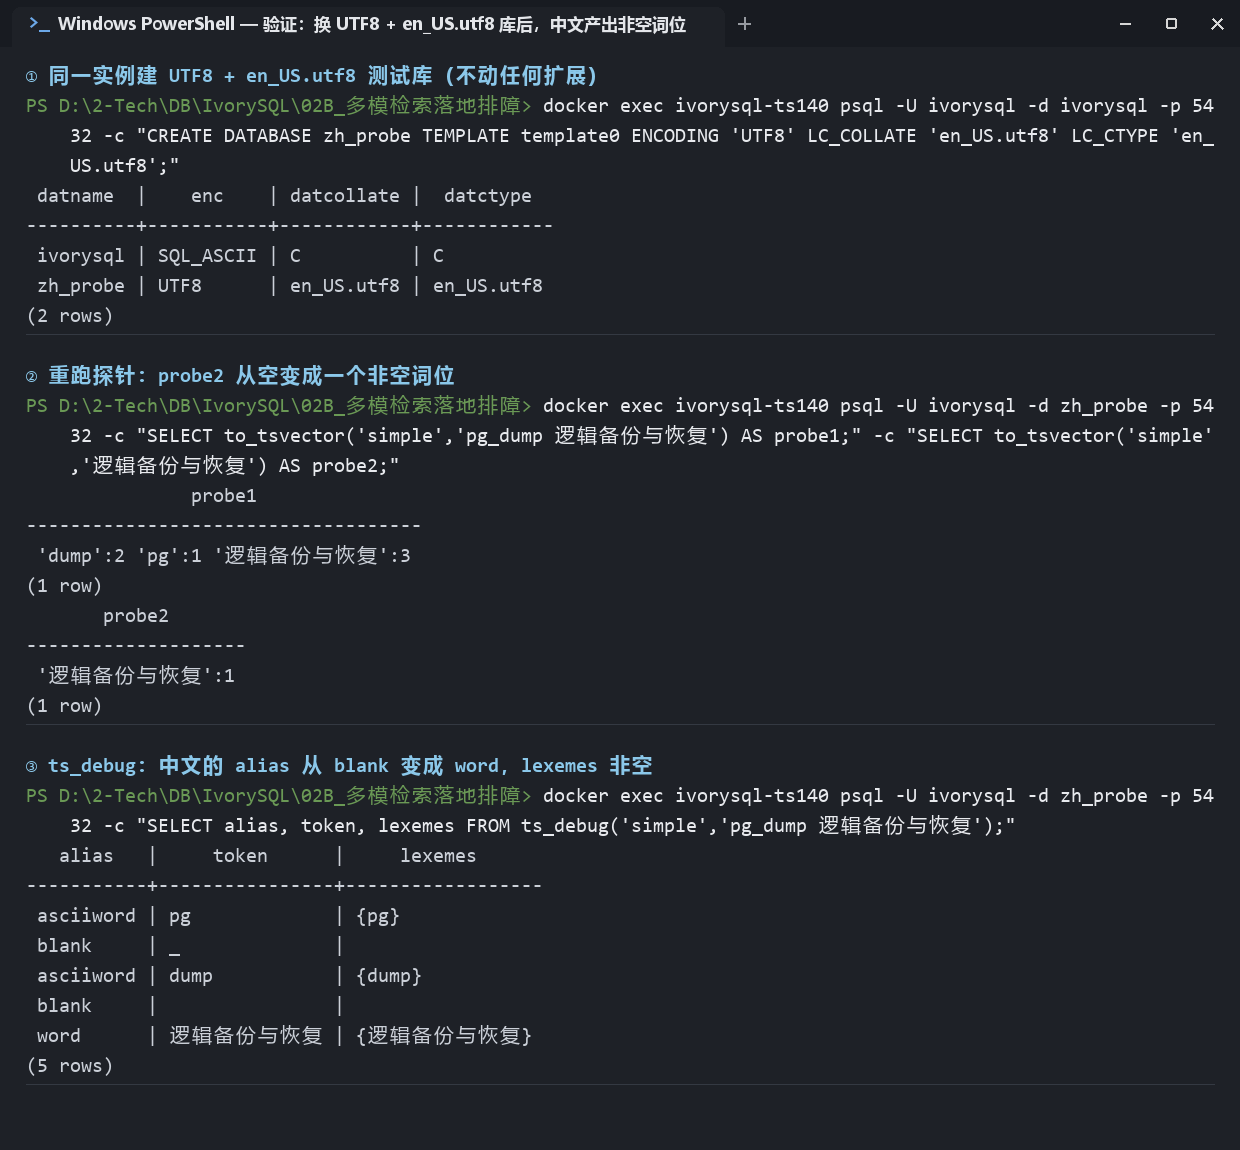
Figure 4: Verification—same instance, same set of extensions, changing only the database encoding and lc_ctype turns Chinese from zero lexemes into produced lexemes
Remember One Line
For Chinese, simple is not "poor quality"—it is "zero output". Before going live, run SELECT to_tsvector() to see what the index actually sees, and only then discuss retrieval quality.
3. Pitfall 3: One Scalar Subquery Makes the HNSW Index a Wasted Build
Symptom
First, what "#2" is: the kb_pgops dataset has 12 documents in total, with primary key ids from 1 to 12, so #2 is the one with id=2. "Using #2 as an anchor to find similar documents" is a very common requirement—first fetch that document's vector from the database, then use it as the query vector to scan the whole table for the 5 most similar (the "people who read this also read…" pattern). It is only natural to write the SQL like this (note that -d must be the business database ivorysql, which has kb_pgops installed; the encoding probe database zh_probe created in Pitfall 2 has no such table, and connecting to the wrong database only yields relation "kb_pgops" does not exist):
# Run the anchor query directly first
docker exec ivorysql-ts140 psql -U ivorysql -d ivorysql -p 5432 -c "SELECT id FROM kb_pgops ORDER BY embedding <=> (SELECT embedding FROM kb_pgops WHERE id=2) LIMIT 5;"

# Then look at the execution plan (Figure 5 is the output of this one)
docker exec ivorysql-ts140 psql -U ivorysql -d ivorysql -p 5432 -c "EXPLAIN (ANALYZE, BUFFERS, COSTS OFF) SELECT id FROM kb_pgops ORDER BY embedding <=> (SELECT embedding FROM kb_pgops WHERE id=2) LIMIT 5;"
An InitPlan pops up in EXPLAIN (ANALYZE, BUFFERS), and the plan degrades to Seq Scan + Sort—the HNSW index stands by watching, unused.
This plan tree has to be read layer by layer—do not be fooled by the Index Scan inside it (the easiest place to misjudge when running it by hand):
Limit                                   ← outermost: truncate to 5 rows
  InitPlan 1                            ← the scalar subquery executed separately first: fetch the vector of #2
    -> Index Scan using kb_pgops_pkey       uses the [primary key btree index], Index Cond: (id = 2), scanning only 1 row
  -> Sort                               ← the main retrieval path: sorting
       Sort Key: embedding <=> (InitPlan 1).col1
       -> Seq Scan on kb_pgops              [full table scan] of 12 rows, then computing the distance row by row and sorting
-
The Index Scan using kb_pgops_pkey under InitPlan is only the subquery taking the primary key index when it "fetches the anchor vector"; it has nothing to do with vector retrieval;
-
The main path that actually does the "find similar" work is Sort → Seq Scan, covering all 12 rows without missing one;
-
To judge whether HNSW was used, just look at whether the name kb_pgops_hnsw_idx appears in the plan—if it does not, it was not used.
Root Cause
When the vector is not a literal but "a value computable only at run time", ORDER BY embedding <=> <scalar> cannot be recognized by the HNSW access method as an indexable sort expression, and the planner can only do a full table scan + sort.
For the same query, writing the vector as a literal (or a bind parameter) immediately turns the plan into Index Scan using kb_pgops_hnsw_idx. On a 12-row small table the two show no speed difference; at the million-row scale it is an order-of-magnitude gap.
Fix (by Priority)
First choice (the real cure): compute the vector in the application layer and pass it in as the bind parameter $1::vector. The vector is then determined at planning time, the HNSW index is wired in, and large tables use Index Scan. This is the only form that truly cures this pitfall. The two forms differ only in how the query vector is passed:
-- ✗ Anchor form: the vector comes from a scalar subquery, so HNSW cannot be used (the degradation reproduced in this article)
SELECT id FROM kb_pgops
ORDER BY embedding <=> (SELECT embedding FROM kb_pgops WHERE id = 2)
LIMIT 5;

-- ✓ Parameter form: the vector is already determined at planning time, so HNSW is wired in (the application layer binds $1::vector)
SELECT id FROM kb_pgops
ORDER BY embedding <=> $1::vector
LIMIT 5;
If the requirement to "fetch a document from the database as an anchor" cannot be eliminated, split it into two steps in the application layer: first query the anchor vector, then pass it back as a bind parameter for a second query—do not nest two layers inside one SQL statement.
Verification
Side-by-side plans: sql/02_vec_plan_check.sql first produces the default plan in the same session (Seq Scan + Sort, hit=6), then SET enable_seqscan=off to produce the comparison plan (Index Scan using kb_pgops_hnsw_idx, about 34 buffer pages), and finally automatically RESETs. One command runs all three segments (PowerShell 5.1 does not support < redirection, so wrap it in cmd /c):
cmd /c "docker exec -i ivorysql-ts140 psql -U ivorysql -d ivorysql -p 5432 < sql\02_vec_plan_check.sql"
The plan captured in this article for the anchor form (the Sort Key plainly shows (InitPlan 1).col1):
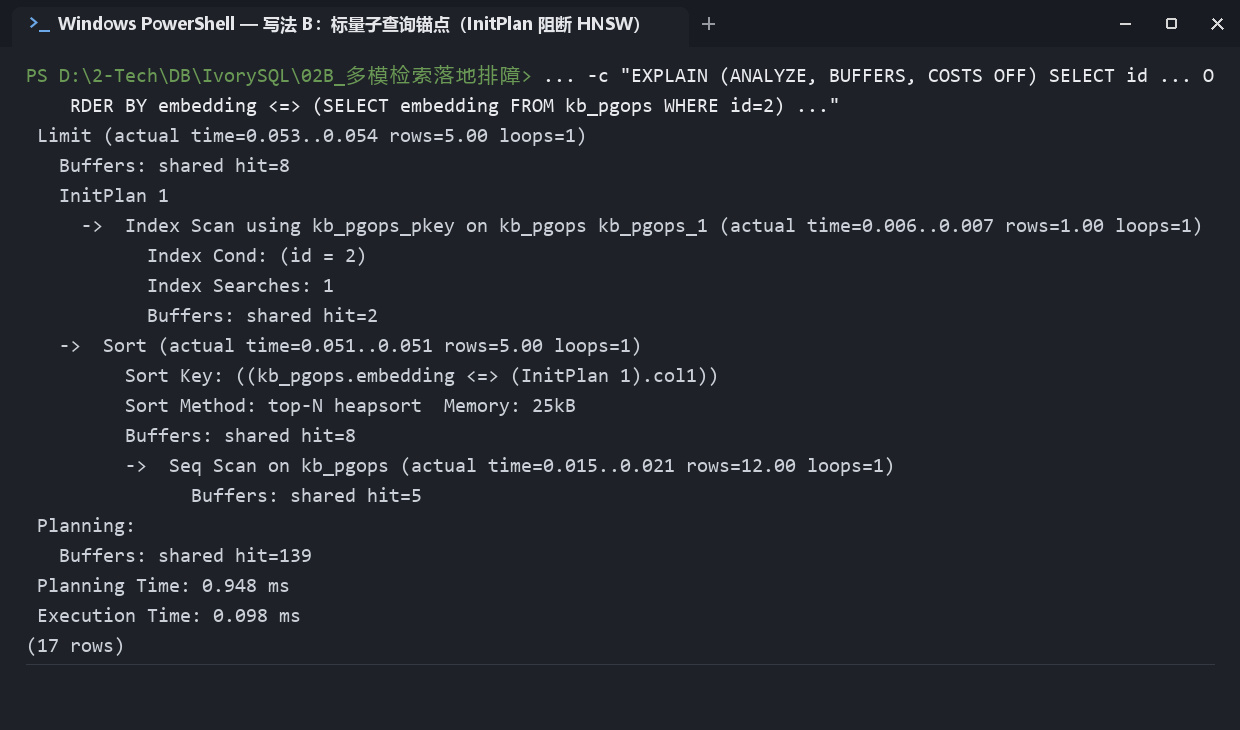
Figure 5: Pitfall 3 evidence—the primary key Index Scan under InitPlan 1 only fetches the vector of #2; the main path Sort → Seq Scan scans the whole table, and kb_pgops_hnsw_idx never appears throughout (Buffers readings fluctuate slightly with cache warmth, but the plan shape does not change)
Remember One Line
How the query vector is passed into the SQL determines whether HNSW can be used at all. The habit of "fetch a row from the database to use as the query" often does exactly the thing that disables the index.
4. Pitfall 4: w=1 Does Not Mean "a BM25 Index Scan"
First, what w is: in hybrid retrieval the final score is the sum of the two paths' scores—
total score = w × BM25 text score + (1 − w) × vector similarity.
w is the mixing coefficient between BM25 and vectors: w=1 means "BM25 accounts for 100% of the result score and the vector score is multiplied by 0 and discarded"; w=0 means "look only at vectors"; w=0.3 means BM25 accounts for 30% and vectors 70%.
It only decides how the two paths' scores are added; it does not decide whether the BM25 path uses an index, nor whether non-matching rows take part in sorting. The pitfall below is exactly a confusion of these two things.
Symptom
Set the weight to w=1 in the fusion SQL (intuitively = "listen entirely to BM25"), and the resulting ranking shows [2,3,4,5,1]—
Q3's BM25 clearly matched only #2, so how did the rest sneak in? Note: the order of tied rows is determined by physical storage; once the table has been through VACUUM / UPDATE / INSERT, this "ranking within the tie" can change hands—it is unstable at the root.
Root Cause
Many people assume w=1 automatically makes the database behave like a standalone BM25 query and "return only documents that hit the keywords". These are two entirely different levels of concern:
| What you think w=1 does | What actually happens in the fusion CTE |
|---|---|
| Automatically scores only matching rows | In the CTE, BM25 is a per-row function; it computes for every one of the 12 rows in the table |
| Automatically uses the <@> index to filter out irrelevant rows | It takes the function path; the 11 rows that miss the keywords are still computed, just given a score of 0.0 |
| The result equals a standalone BM25 ranking | #2 = 1.0 and the other 11 rows are all 0.0, all tied |
The problem lies in the final sorting step: with ORDER BY total score DESC LIMIT 5—
-
#2 has a total score of 1.0 and takes first place securely;
-
The remaining 11 rows are all 0.0, tied. When PostgreSQL encounters a tie it takes the first few by physical storage order (the row's actual location on disk), and physical order is not id order—it also gets scrambled by VACUUM / UPDATE / INSERT.
So: the ranking becomes [2,3,4,5,1] because #2 is the champion and the next 4 were grabbed from the 11 zeros by physical order; on a static table repeated runs look the same, but as soon as VACUUM / UPDATE / INSERT has disturbed the physical order, a different batch is grabbed from within the tie.
Reproduced by measurement on 1.4.0 (weight sweep, Q3):
w=0.0 : ids=[2, 3, 8, 6, 10] hits=3/3
w=0.3 : ids=[2, 3, 8, 6, 10] hits=3/3
w=0.5 : ids=[2, 3, 8, 6, 10] hits=3/3
w=0.7 : ids=[2, 3, 8, 6, 10] hits=3/3
w=1.0 : ids=[2, 3, 4, 5, 1] hits=2/3     ← the degradation happens here
Why are w=0 and w=0.3 stable instead? Because the vector score path has no zero-score problem—each of the 12 rows has a different similarity, and the smaller w is, the more the vector score spreads rows apart, so there is no mass of 0.0 ties. The pitfall only surfaces at w=1, when the vector coefficient is multiplied to 0.
Where w lives in the code, and how to set it to 1: when writing the fusion SQL by hand, it is the two coefficients on the final scoring line:
-- General form: w is the BM25 path coefficient and (1-w) is the vector path coefficient
round((w*b.ns + (1-w)*v.ns)::numeric, 4) AS hybrid_s
-- w=1 in sql/04a_w1_zero_tie.sql: BM25 coefficient 1.0, vector coefficient 0.0
round((1.0*b.ns + 0.0*v.ns)::numeric, 4) AS hybrid_s
-- Swap the two coefficients for 0.5/0.5 to get w=0.5
When using the accompanying scaffolding, w is the argument to build_sql(..., weight=w); the sweep levels [0.0, 0.3, 0.5, 0.7, 1.0] are configured in hybrid.weights of code/experiment_kit/configs/kb_pgops_ts140.json, and w=1.0 is the boundary level of the sweep.
Scenarios where you really would set w to 1: ① temporarily degrading to "pure keyword retrieval" while debugging, taking the BM25 single-path result as a comparison baseline; ② a weight-tuning sweep reaching the boundary value 1.0 (the degradation in this article was swept out exactly this way—see the weight sweep table above); ③ certain business queries that trust only exact words (error codes, model numbers, SQL keywords), where the semantic path is deliberately turned off; w=0 is the symmetric other end (pure vector). All three scenarios are reasonable—the real pitfall is assuming that "setting w=1 is equivalent to a standalone BM25 query": w only changes score weights, not the candidate set or the execution path; non-matching rows still stay in the ranking with a score of 0 and occupy slots (that is, the three-level difference in the comparison table above).
Fix
Whether to keep or discard zero-score candidates is a policy that must be written out explicitly when designing fusion SQL—it cannot be left to the default ordering. If you want w=1 to be strictly equivalent to standalone BM25, filter explicitly in the CTE so that only rows that truly match take part in the fusion. Here is a detail you can only learn by measurement: on the per-row function path, non-matching rows get 0.0 rather than NULL (only when a BM25 index scan is used do non-matching rows not appear at all, manifesting as NULL), so writing only IS NOT NULL cannot filter them out—the zero scores must be removed too:
-- Filter at the source of bm25_n; zero-score candidates then naturally do not take part in the fusion at the later inner join
bm25_n AS (
  SELECT id, /* …min-max normalization… */ AS ns
  FROM (SELECT * FROM bm25_r WHERE s IS NOT NULL AND s <> 0) b0
)
Why s <> 0 is safe: pg_textsearch's BM25 score is negative for matching rows and 0.0 for zero matches, so a matching row can never be exactly 0; if your corpus can legitimately produce a 0 score, use a "did it match" predicate such as content @@ plainto_tsquery('simple', 'query terms') instead, which is more rigorous.
Verification
The accompanying script runs three segments in a row: ① the w=1.0 degradation; ② the fixed result after adding the s IS NOT NULL AND s <> 0 filter; ③ the standalone BM25 path for comparison.
To see all three segments at once, run the merged version (on PowerShell use cmd /c redirection to avoid Chinese encoding problems):
cmd /c "docker exec -i ivorysql-ts140 psql -U ivorysql -d ivorysql -p 5432 < sql\04_zero_score_tie.sql"
To run and check segment by segment, the three commands below correspond to the three segments (expected outputs are annotated, matching the three panels of Figure 6 one to one):
# ① w=1.0 degradation: expect 5 rows, ranking [2,3,4,5,1], with the last four rows having hybrid_s all 0.0000
cmd /c "docker exec -i ivorysql-ts140 psql -U ivorysql -d ivorysql -p 5432 < sql\04a_w1_zero_tie.sql"

# ② Fix: expect only 1 row left (id=2, with bm25_n/vec_n/hybrid_s all 1.0000)
cmd /c "docker exec -i ivorysql-ts140 psql -U ivorysql -d ivorysql -p 5432 < sql\04b_filter_fix.sql"

# ③ Standalone BM25 comparison: expect only id=2, raw BM25 score -2.0694
#    (ORDER BY <@> uses a BM25 index scan, and zero-match documents are not returned—a neat contrast with the per-row function path in ①)
cmd /c "docker exec -i ivorysql-ts140 psql -U ivorysql -d ivorysql -p 5432 < sql\04c_bm25_only.sql"
Measured in this article's container (Figure 6): the ranking in ① is [2,3,4,5,1] with the last four hybrid_s all 0.0000; after filtering in ② only #2 remains; ③ standalone BM25 also returns only #2—after the fix the two paths agree strictly and repeated runs are stable.
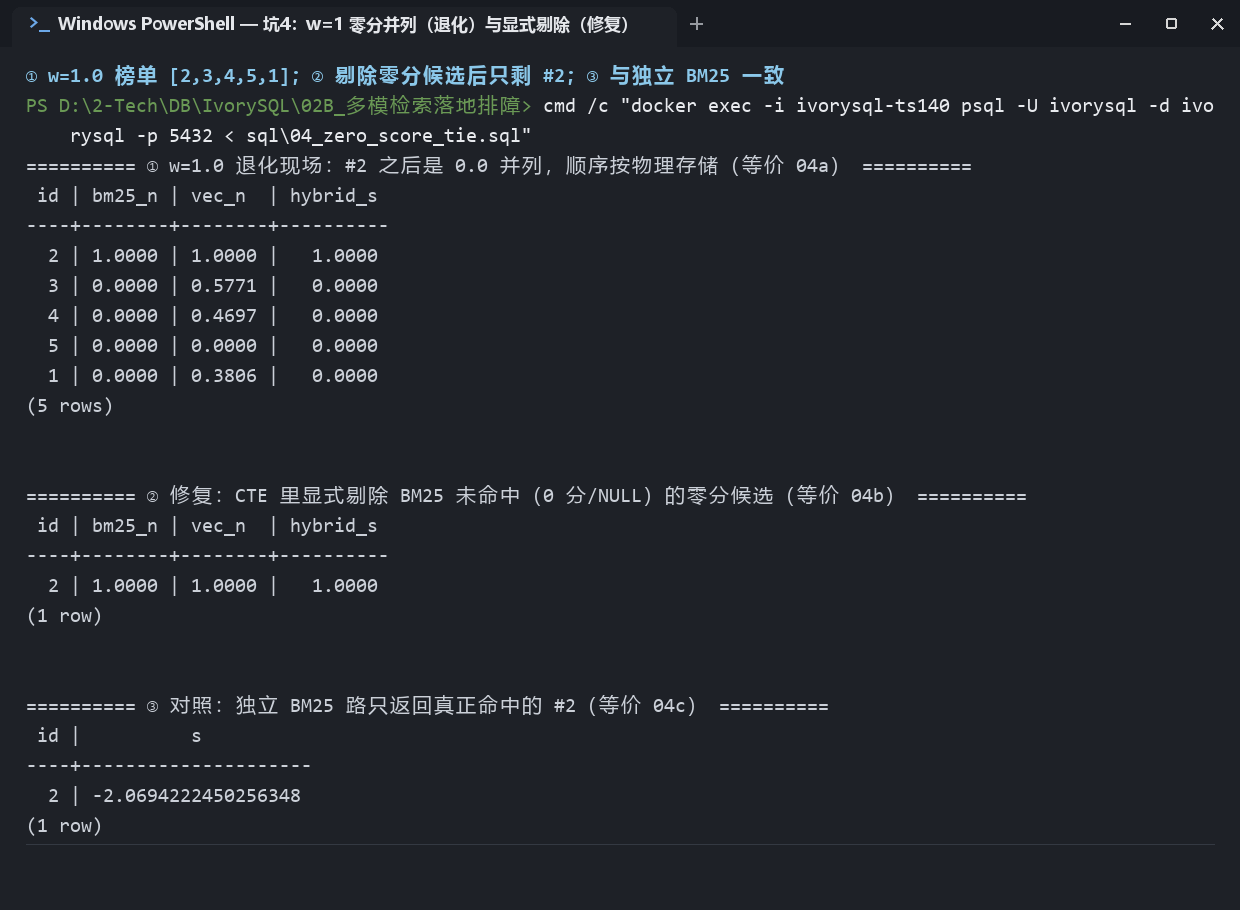
Figure 6: Pitfall 4 evidence—zero-score ties fabricate a "fake ranking", and after explicit removal it agrees with the standalone BM25 ranking
Remember One Line
Fusion is not done by just pasting two SQL paths together. "Give non-matching rows a score of 0" and "non-matching rows do not take part" are two completely different designs.
5. Pitfall 5: HNSW Built, Yet a Seq Scan Is Used, idx_scan = 0
Symptom
The HNSW index is built (DDL in 0.4, namely kb_pgops_hnsw_idx), yet EXPLAIN shows a Seq Scan; query pg_stat_user_indexes and idx_scan = 0.
First reaction: "the index was a wasted build / the parameters are misconfigured".
Root Cause: the Planner Is Saving You Money
Measured comparison on the 12-row small table (captured on 1.4.0):
| Path | Plan | Buffers |
|---|---|---|
| Vector (default) | Seq Scan + Sort (top-N heapsort) | hit = 6 |
| Vector (forced enable_seqscan=off) | Index Scan using kb_pgops_hnsw_idx | hit = 34 |
| BM25 | Index Scan using kb_pgops_bm25_idx | hit = 32 |
Computing 12 cosine distances over the whole table needs only 6 shared buffer pages; going through HNSW touches about 34 pages (including heap fetches) and is actually more expensive.
This is not "the index is useless"; it is "the full scan is cheaper this time".
To see the comparison for yourself, just run the script from Pitfall 3 (its first two segments are this section's content):
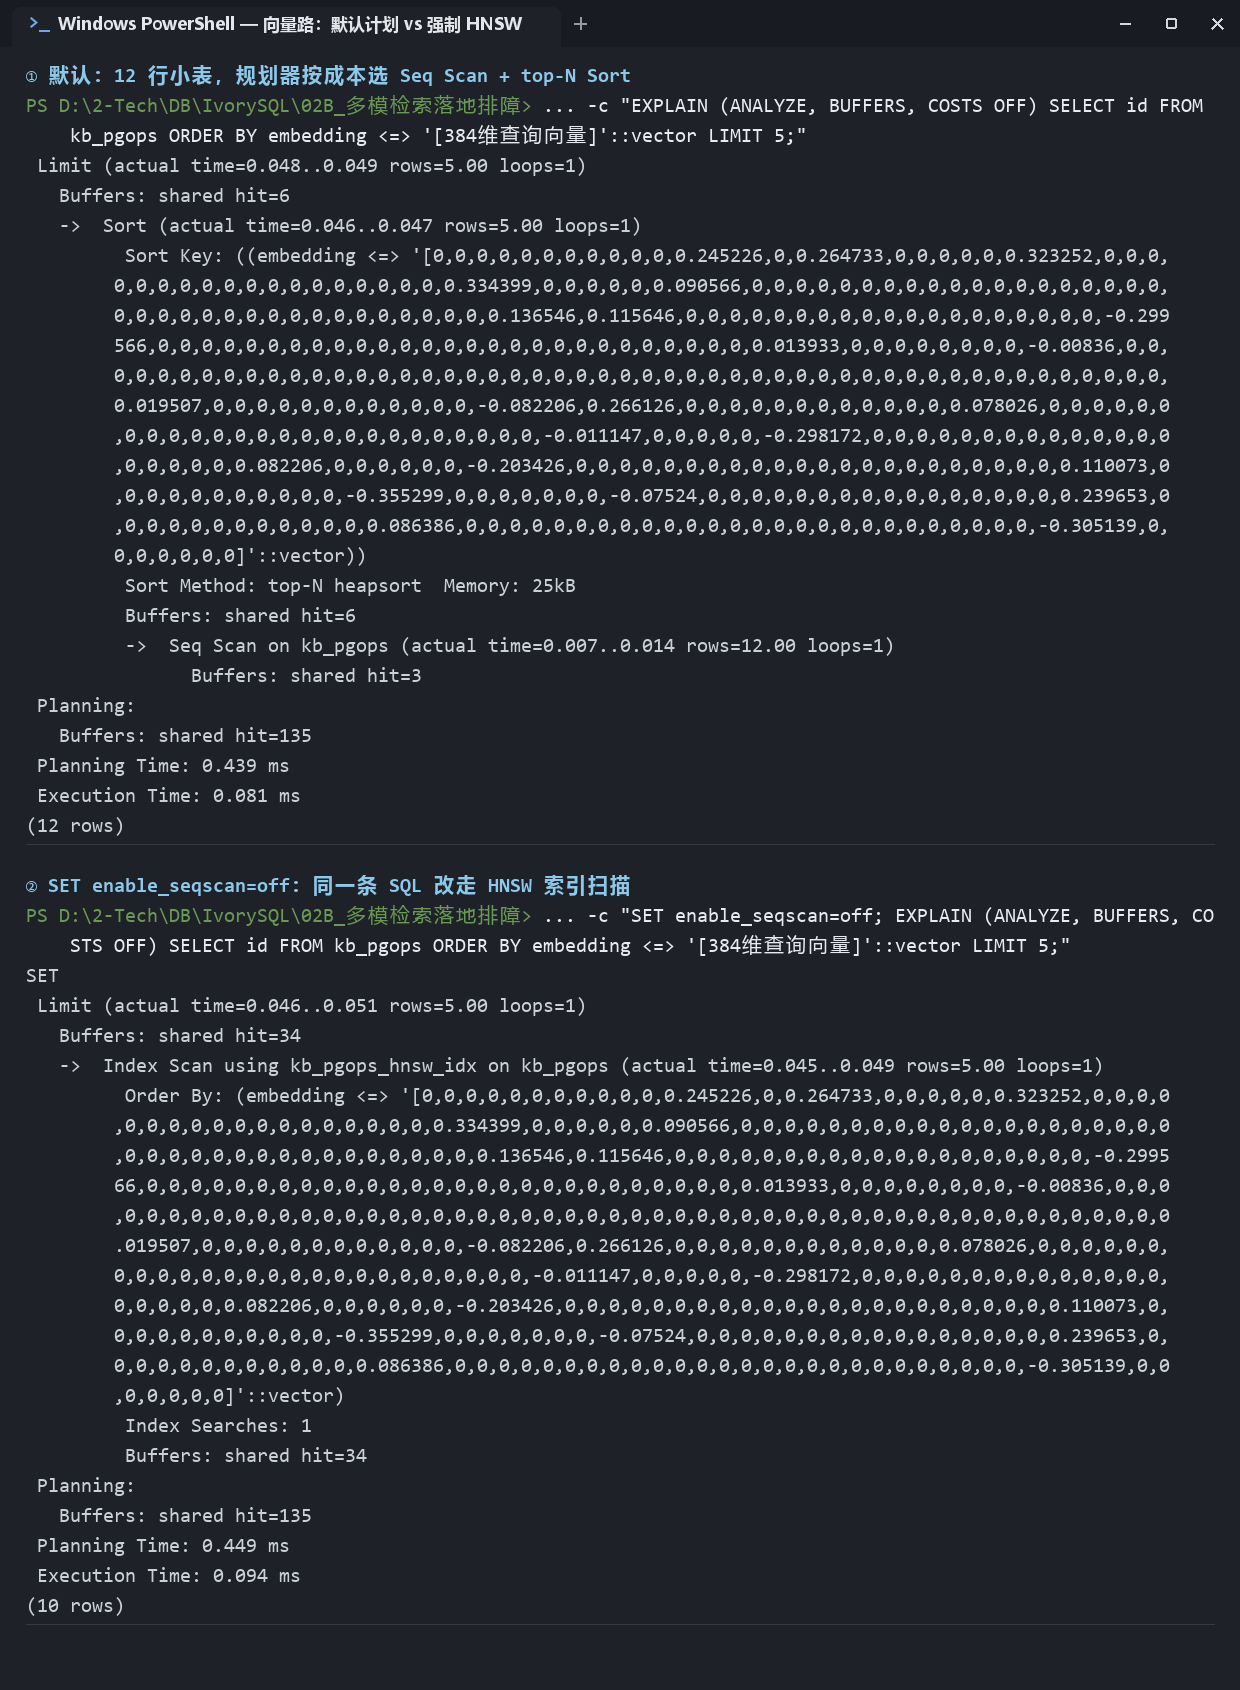
cmd /c "docker exec -i ivorysql-ts140 psql -U ivorysql -d ivorysql -p 5432 < sql\02_vec_plan_check.sql"
Figure 7: Pitfall 5 evidence—the planner chooses Seq Scan because it touches fewer buffer pages (6 vs about 34)
An interesting piece of measured corroboration—the idx_scan counts in this article's container:
 kb_pgops_bm25_idx |  42    ← BM25 queries essentially all go through the index
 kb_pgops_hnsw_idx |   8    ← its few uses all came from manually SET enable_seqscan=off in the comparison experiments
 kb_pgops_pkey     |  44
idx_scan is a cumulative counter, and the value only grows along with the container's execution history (when you reproduce it you will almost certainly not get exactly 42/8/44); what matters is the relationship: under natural queries, the number of HNSW scans stays close to 0 over time.
The index is not broken; the planner has done the math.
Do not treat Buffers as a fixed constant: it fluctuates with the index's physical size and cache warmth (the readings change before and after REINDEX on the same index, and between a freshly started container and one that has been running a while). Look at the plan shape (whether the index is used), not memorized numbers.
Fix
No fix needed. There are only two things to do:
-
On small tables, calmly accept the Seq Scan;
-
Once the data volume grows, re-check with EXPLAIN whether it switches over; do not force the index by feel.
If you must verify that HNSW works (for example the comparison experiment in Pitfall 3), use SET enable_seqscan=off to verify temporarily, and remember to RESET when done—do not leave that switch in a production session.
Remember One Line
idx_scan = 0 is normal on a small table. The planner is a housekeeper who does the math, and it chooses Seq Scan because that is cheaper.
6. Pitfall 6: HNSW Maintenance and Capacity Budgeting
6.1 Maintenance: Three Measured Conclusions
| Common claim | Measured conclusion |
|---|---|
| "New rows have a window where they cannot be found" | Wrong. pgvector 0.8.5's HNSW supports incremental maintenance; INSERT/UPDATE/DELETE need no REINDEX, and new rows are immediately searchable. That is old lore from IVFFLAT before 0.5.0. |
| "Periodic REINDEX for upkeep" | Wrong. REINDEX is O(N log N) heavy work; do it only when changing dimensions, changing m/ef_construction, or when graph quality has clearly degraded. In production use REINDEX INDEX CONCURRENTLY. |
| "Changing the embedding dimension" | The index must be rebuilt; there is no ALTER path. |
Three more practical notes:
-
Dead nodes are reclaimed by VACUUM: updates/deletes leave dead nodes in the graph, which do not affect correctness (they are skipped during a scan) but take up space; after a large batch of writes you can manually run VACUUM (ANALYZE) table_name;
-
Speeding up large index builds: within the session, SET maintenance_work_mem='4GB'; SET max_parallel_maintenance_workers=4;, and restore them after the build;
-
Search-side GUCs (measured on 0.8.5): hnsw.ef_search (default 40), hnsw.iterative_scan (improves recall with filter conditions), hnsw.max_scan_tuples (default 20000).
6.2 Capacity: the Formula Underestimates, and the Dimension Conversion Is "Double the Dimensions, Double the Size"
Measured anchors (same container, same index build parameters m=16, ef_construction=64, with 10,000 rows generated for each dimension):
| Dimensions | HNSW index for 10k rows | Equivalent per row | Extrapolated to 1M rows |
|---|---|---|---|
| 384 (measured) | 20 MB | 2048.8 B/row | ≈ 1.91 GiB |
| 768 (measured) | 39 MB | 4096.8 B/row | ≈ 3.82 GiB |
| 1536 (measured) | 78 MB | 8192.8 B/row | ≈ 7.63 GiB |
The measured sizes of the three indexes on this article's 12-row table can be reproduced with a single psql meta-command (Figure 8):
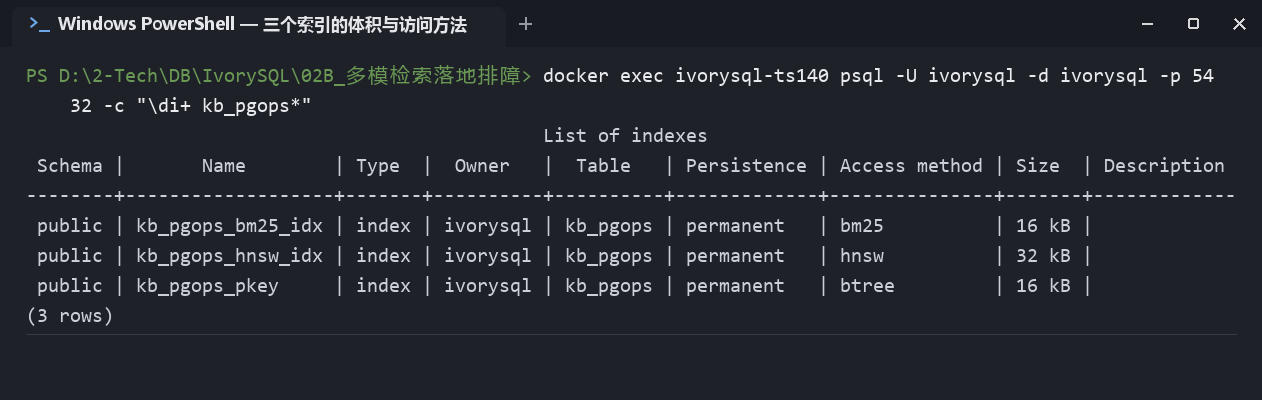
docker exec ivorysql-ts140 psql -U ivorysql -d ivorysql -p 5432 -c "\di+ kb_pgops*"
Figure 8: Measured sizes of the three access methods: bm25 / hnsw / btree
Why the formula cannot be applied directly: the theoretical figure is vector body 4 × dimensions + 8 = 1544 B/row (384 dimensions), plus an empirical 150–300 B/row for graph links ≈ 1694–1844 B/row, which is about 10–20% lower than the measured 2048.8 B. The gap comes from intra-page overhead, the multi-layer graph structure, and the index tuple header.
Dimension conversion: the measured conclusion is "double the dimensions, double the bytes per row too".
This is very easy to get wrong. Intuition suggests that "only the vector body (4 B/dimension) grows with dimensions, while the graph links are fixed overhead", so doubling the dimensions should increase capacity by only a fraction—measurement says otherwise. The byte counts for the three levels above are 2048.8 → 4096.8 → 8192.8, with a stable coefficient of about 5.33 B/dimension; after subtracting the vector body, the remaining overhead is 504.8 / 1016.8 / 2040.8 B, which itself grows with dimensions (about 1.3 B/dimension). The reason is that once rows get wider, intra-page alignment, the tuple header, and the storage overhead of the multi-layer graph are magnified as well.
So estimate capacity by "double the dimensions, double the capacity"—this is both conservative and closest to measurement. Never use a figure that counts only the vector body; that underestimates by more than 20%.
One field reminder along the way—at 1536 dimensions with only 10,000 rows, index building already ran into this:
NOTICE:  hnsw graph no longer fits into maintenance_work_mem after 9665 tuples
DETAIL:  Building will take significantly more time.
HINT:  Increase maintenance_work_mem to speed up builds.
The higher the dimensions and the more rows, the easier it is to trigger. Raise maintenance_work_mem as described in §6.1 before building the index—do not wait until it has already slowed down to notice.
Budgeting advice:
-
Take bytes per row by dimension: 384 dims 2048.8 B / 768 dims 4096.8 B / 1536 dims 8192.8 B (m=16 basis). At 384 dimensions, 1 million rows ≈ 1.91 GiB and 10 million rows ≈ 19 GiB
-
For other dimensions, roughly estimate with 5.33 B/dimension × dimensions, or measure with the method below
-
Extra temporary space is needed during index building (affected by maintenance_work_mem)
-
Reserve 1.5–2× the estimated value in production
-
The size of the BM25 inverted index depends on the total number of tokens in the corpus; it cannot be derived from row count and must be measured
The most accurate method: create a table with N rows of the same dimension, and after CREATE INDEX run SELECT pg_relation_size('index_name')/N to get the true bytes per row. The script is in code/probe_capacity.sql (384 dimensions); the side-by-side measurements for the three dimension levels above are in code/probe_capacity_dims.sql.
Remember One Line
HNSW's maintenance burden is lighter than you would think (incremental and immediately visible), but its disk burden is heavier than the formula suggests (10–20% higher when measured), and doubling the dimensions doubles the capacity—do not count only the vector body.
7. Pitfall 7: Nothing to Look At After Go-Live—Building a Monitoring Baseline from Scratch
7.1 pg_stat_statements: It Is in the Image, but Not Enabled by Default
First check whether it is there (copy and run directly):
docker exec ivorysql-ts140 psql -U ivorysql -d ivorysql -p 5432 -c "SELECT name, default_version, installed_version FROM pg_available_extensions WHERE name='pg_stat_statements';"
Measured output from this article's container—note: "a row comes back" does not equal "it is enabled":
name        | default_version | installed_version
--------------------+-----------------+-------------------
 pg_stat_statements | 1.12            |
(1 row)
default_version = 1.12 only means the image ships this contrib module; the key is that installed_version is empty—it means "available but not yet CREATE EXTENSION'd". Take another look at the preload list: it is not there either:
docker exec ivorysql-ts140 psql -U ivorysql -d ivorysql -p 5432 -c "SHOW shared_preload_libraries;"
# Measured: gb18030_2022, liboracle_parser, ivorysql_ora, pg_textsearch (no pg_stat_statements)
It belongs to contrib and must appear in shared_preload_libraries before it can work. Three steps to enable it:
- Append pg_stat_statements to shared_preload_libraries in ivorysql.conf inside the container (keep the existing entries)
2. docker restart ivorysql-ts140
3. CREATE EXTENSION pg_stat_statements;
Once enabled, it can answer "which SQL is the most time-consuming in total, which query consumes the most buffers". In a scenario like multimodal retrieval where every millisecond costs money, running without it is driving blindfolded. It is a must-enable in production.
7.2 Dead Tuples and Index Usage
-- Dead tuple ratio (watch this closely for write-heavy tables)
SELECT relname, n_live_tup, n_dead_tup, n_tup_upd, n_tup_del,
       round(100.0 * n_dead_tup / NULLIF(n_live_tup + n_dead_tup, 0), 2) AS dead_pct
FROM pg_stat_user_tables WHERE relname = 'kb_pgops';

-- How many times each index was used
SELECT indexrelname, idx_scan, idx_tup_read, idx_tup_fetch
FROM pg_stat_user_indexes WHERE relid = 'kb_pgops'::regclass;
Empirical thresholds:
| Trigger condition | Action |
|---|---|
| dead_pct > 10% | Manual VACUUM ANALYZE |
| dead_pct > 20% | Evaluate VACUUM FULL (takes a table lock) or an online rebuild during off-peak hours |
| small table idx_scan = 0 | Normal, see Pitfall 5; only a large table staying at 0 needs investigation |
7.3 An Inspection Checklist
String it into a scheduled job (full script in sql/03_monitor.sql):
-
Canary probes (see Appendix D)—alert as soon as the BM25 index returns 0 rows; this is the fastest way to detect "query anomalies"
-
Index state indisvalid/indisready/indislive—note that being normal does not mean it computes correctly
-
Dead tuple ratio—thresholds 10% / 20%
-
Index usage—idx_scan=0 is normal for small tables; only a large table staying at 0 needs investigation
-
Top 10 slow queries—requires pg_stat_statements to be enabled first
Remember One Line
Most multimodal retrieval failures are "silent"—no error, no crash, just gradually becoming inaccurate. Without inspection you will only find out much later.
8. If You Only Remember Three Things
Each of the 7 pitfalls ends with a "remember one line"; the three below are the points most likely to directly cause a production incident or distort an evaluation (covering Pitfalls 3, 5, and 6 and Appendix D); for the rest, just look back at the quick overview table in 0.3.
-
How the query vector is passed determines whether HNSW takes effect. A bind parameter gets in; a scalar subquery does not (Pitfall 3).
-
The planner choosing Seq Scan is saving you money; do not rush to change parameters. But capacity must be computed from measured bytes per row—the formula underestimates by 10–20% (Pitfalls 5 and 6).
-
Inspection must cover "query results", not just "index state". The system catalog saying the index is alive does not mean it computes correctly (see Appendix D).
Appendix A: The 12-Row Minimal Comparison Experiment (Optional)
None of the seven pitfalls depends on this experiment. If you want to know "who really recalls better, BM25 or vectors", you can run through this minimal set—but please finish reading this statement first.
A.1 What It Can and Cannot Prove
| What it can prove | How the fusion mechanism works, execution plan shapes, operational cost (deterministically reproducible) |
| What it cannot prove | ① That vectors are inherently better than BM25—the 384-dimensional vectors in this article are token-hash constructs, not a semantic model; ② That hybrid improves recall—the measured gold hits for vectors and hybrid are both 9/9 (basis below); ③ Any "capability evaluation"—the gold for the 5 queries was self-labeled by the author based on content, 9 labeled points in total (Q2 and Q3 each contain 3 relevant documents), and they happen to all fall within the vector Top-5, so 9/9 is a mathematical necessity of the labeling structure |
So the Recall@5 column (that is, "the hit rate within the first 5 results"; this article's 5 queries have 9 gold labeled points in total, all falling within the Top-5 = 9/9) can only be read as "a consistency check for the mechanism demonstration", not as a capability score. For a real capability evaluation, switch to an external standard dataset (such as a public BEIR / MTEB subset plus the official qrels).
A.2 How to Run
# ① Create the table + load the 12 short articles + build both indexes (first copy the script into the container; file locations in Appendix B)
docker cp code/kb_pgops_init.sql ivorysql-ts140:/tmp/
docker exec -i ivorysql-ts140 psql -U ivorysql -d ivorysql -p 5432 -f /tmp/kb_pgops_init.sql

# ② Run the five-query three-path comparison + weight sweep in one shot
cd code/experiment_kit
python run_all.py --config configs/kb_pgops_ts140.json
After about 1 minute you get all tables in results/<timestamp>/article_tables.md. Zero third-party dependencies—the Python 3 standard library is enough.
Key self-check points measured on 1.4.0 in this article (readers re-running should get the same results):
Q5: bm25 top3=[11,6,7] / vec #11 ranked 3rd / hybrid #11 ranked 1st
Weight sweep Q3 w=1.0 : ids=[2, 3, 4, 5, 1] hits=2/3   ← the scene of Pitfall 4
A.3 Switching to Your Own Data
Sample 8 or more real business queries and re-run:
-
BM25 also nearly hits everything → the queries are dominated by exact terminology and the vector side can be skipped
-
Only 50–70% → the hybrid payoff is worth investing in
Only you can do this step, because the real query corpus is in your hands.
A.4 Three Disciplines of Evaluation Design: Make Conclusions Withstand Others' Re-runs
These three are the checks actually used to "hold myself accountable" when designing the experiments in this article; they are also a checklist readers can compare against item by item when health-checking their own multimodal retrieval experiments or reviewing someone else's evaluation report.
| Discipline | Corresponding trap | Self-check action you can copy directly |
|---|---|---|
| ① First check the intersection of gold with each path's Top-K, then talk about hit rate | If all of the gold falls within one path's Top-K, that path's "perfect score" is merely a product of the labeling structure, not evidence of capability (the 9/9 in A.1 of this article—9 gold points across 5 queries all hit—falls into this category and has been deliberately downgraded to "a mechanism consistency check") | Intersect the gold set with each path's Top-K; if some path's intersection = all of the gold, that path's hit rate must not be used as a capability conclusion—switch to an external standard dataset (see the end of A.1) |
| ② When saying "improvement multiplier", the reference frame must be stated | On the same dataset, "hybrid is 2–3× BM25" and "hybrid is 7–10× vectors" can both hold (~ denotes a range, read as "2 to 3 times", not a strikethrough); a multiplier without its reference frame carries no information | Write multipliers uniformly as "an N× improvement relative to path X", and give each path's baseline score in the same table so readers can verify the arithmetic themselves |
| ③ Accept "structural consistency" and "numerical consistency" separately | Values like Buffers hits and idx_scan fluctuate with the index's physical size, cache warmth, and cumulative counts; putting them on a "must be bit-for-bit identical" list means that once a reader's re-run does not match, they will doubt all the conclusions along with it | Split the acceptance checklist into two columns: plan shape and ranking id sequence are required to be exactly identical; Buffers/counters are only required to be in the same order of magnitude, with the fluctuation basis noted (all figure captions in this article are annotated this way) |
In one line: the credibility of an evaluation does not come from pretty numbers, but from others re-running your steps and knowing clearly which results must be identical and which will naturally fluctuate.
Appendix B: File List
The accompanying files are open-sourced on GitHub; readers can clone and use them by the relative paths in the table above:
Repository: https://github.com/markboluo26330/ivorysql-multimodal-series
Clone: git clone https://github.com/markboluo26330/ivorysql-multimodal-series.git
Re-running make_shots.py requires Python 3 + Pillow / matplotlib.
| File | Purpose |
|---|---|
| sql/00_env_check.sql | Environment self-check: extension versions, preload configuration |
| sql/01_canary_probe.sql | Canary probe + index state + REINDEX (the core of Appendix D, a must-have for inspection) |
| sql/02_vec_plan_check.sql | Execution plan comparison for form A / form B (Pitfalls 3 and 5) |
| sql/03_monitor.sql | Dead tuples, index usage, slow queries (Pitfall 7) |
| sql/04_zero_score_tie.sql | Pitfall 4, the three-segment combined run (produces all of Figure 6 at once) |
| sql/04a_w1_zero_tie.sql | Pitfall 4 step ①: the w=1 degradation, runnable on its own |
| sql/04b_filter_fix.sql | Pitfall 4 step ②: the fixed version after explicitly removing zero-score candidates |
| sql/04c_bm25_only.sql | Pitfall 4 step ③: the standalone BM25 path for comparison |
| code/kb_pgops_init.sql | The 12-article dataset + both indexes |
| code/probe_capacity.sql | Measuring HNSW bytes per row (Pitfall 6, 384 dimensions) |
| code/probe_capacity_dims.sql | Side-by-side capacity measurements for the three dimension levels 384 / 768 / 1536 (the basis for the Pitfall 6 conversion) |
| code/experiment_kit/ | One-shot comparison scaffolding (Appendix A, optional; kb_pgops_ts140.json points to the 1.4.0 container) |
| figures/ | The 9 figures in this article (all captured from the 1.4.0 container) |
| make_shots.py | Figure capture script; can be re-run to re-capture (requires Python + Pillow / matplotlib) |
| 06_生产级部署_Dockerfile/ | Production-grade deployment Dockerfile (used for the Appendix C build; compiles multimodal extensions in full from the official image) |
| 版本对照_pg_textsearch_0.6.1_vs_1.4.0.md | Complete measured record of the item-by-item comparison between the two versions |
Appendix C: Reproducing the Environment
C.1 Recommended Path: Full Build from the Official Image (Anyone Can Get It Working)
This path's base image is the official public IvorySQL image registry.highgo.com/ivorysql/ivorysql:5.4-ubi8; it depends on no local private image, so it reproduces just as well on another machine. The build compiles pgvector 0.8.5, Apache AGE, pg_bigm, and pg_textsearch 1.4.0 in sequence, taking about 2–15 minutes (depending on network and machine performance).
# ① Build (the Dockerfile is in this repository's 06_生产级部署_Dockerfile/ directory)
cd 06_生产级部署_Dockerfile
docker build -f Dockerfile -t ivorysql-kb:pg18-ts140 .

# ② Start
docker run -d --name ivorysql-ts140 -p 5436:5432 \
  -e IVORYSQL_PASSWORD=Test@2026 ivorysql-kb:pg18-ts140

# ③ Create extensions + load data
docker exec ivorysql-ts140 psql -U ivorysql -d ivorysql -p 5432 \
  -c "CREATE EXTENSION pg_textsearch;" -c "CREATE EXTENSION IF NOT EXISTS vector;"
docker cp code/kb_pgops_init.sql ivorysql-ts140:/tmp/
docker exec ivorysql-ts140 psql -U ivorysql -d ivorysql -p 5432 -f /tmp/kb_pgops_init.sql
That image preloads four extensions by default (age included). This article's container uses the minimal set (only pg_textsearch is preloaded among the multimodal extensions, without age)—neither affects any conclusion in this article; for the measured value in Pitfall 1, go by your own SHOW shared_preload_libraries.
C.2 Optional Path: Recompile Only pg_textsearch (For Version Comparison)
If you already built the ivorysql-kb:pg18 image following the previous article in this series (Part One), you can use an incremental Dockerfile to recompile only pg_textsearch—results in tens of seconds—which makes it convenient to compare versions 0.6.1 / 1.4.0:
docker build -f Dockerfile.ts_version -t ivorysql-kb:pg18-ts140 .                      # 1.4.0 (default)
docker build -f Dockerfile.ts_version --build-arg TS_VERSION=v0.6.1 \
  -t ivorysql-kb:pg18-ts061 .                                                            # reproduce the old version's failure
Note: that Dockerfile's FROM is the local image ivorysql-kb:pg18; without that base image the build fails. For a first-time reproduction, use C.1.
On how commands are executed: the commands in this article were all measured under Windows PowerShell 5.1. PowerShell 5.1 does not support < input redirection, so feeding a .sql file is uniformly wrapped in a layer of cmd /c "docker exec -i ... < file" (both the body text and the screenshots use this form, which avoids garbled Chinese); alternatively you can docker cp into the container first and then execute with -f. On Linux / macOS / Git Bash, plain < redirection works.
Appendix D: A Pitfall Already Fixed by the New Version
This section records a real failure on 0.6.1. It can no longer be reproduced on 1.4.0, but it is worth keeping for three reasons:
It gives readers still on 0.x a complete troubleshooting sample; it explains why canary probes are worth setting up; and it makes a plain point—prerelease warnings are not there to scare you.
Symptom: All Index States Are t, Yet Queries Return 0 Rows
After the 0.6.1 container has been running continuously and across restarts: kb_pgops_bm25_idx looks perfectly normal in the system catalog—
SELECT indisvalid, indisready, indislive FROM pg_index
WHERE indexrelid='kb_pgops_bm25_idx'::regclass;
-- t | t | t
Yet index scans return 0 rows for every query.
More insidious is that the hybrid path raises no error; the scores just drift quietly: in the fusion CTE the BM25 per-row function path still produces scores, but the corpus statistics are already wrong—it was measured producing "a score of -2.1401 for a document that does not contain pg_dump". This drift triggers no alert at all.
Root Cause: 0.6.1's In-Memory Architecture
0.6.1 uses a pure in-memory inverted index that is rebuilt from the heap table after a restart, and that rebuild path is unreliable in some scenarios—this is the class of risk the official warning at the time pointed to:
WARNING: pg_textsearch v0.6.1 is a prerelease. Do not use in production.
pg_textsearch 1.0 rewrote the architecture entirely into an "in-memory memtable + on-disk segment" design (LSM-style), with the index persisted through WAL. This is the only pitfall that "disappeared" in this upgrade comparison—after two consecutive restarts of the 1.4.0 container, the canary probe returned id=1 consistently, and the scores of the five queries were bit-for-bit identical to before the restart.
The Troubleshooting Techniques Are Still Useful Today
Detection—give every BM25 index 2–3 probes with "known guaranteed results" and fold them into scheduled inspection:
docker exec ivorysql-ts140 psql -U ivorysql -d ivorysql -p 5432 -c \
  "SELECT id FROM kb_pgops ORDER BY content <@> 'pg_dump 备份' LIMIT 1;"
Returning 0 rows (instead of id=1) = retrieval has a problem, alert immediately. The full inspection script is in sql/01_canary_probe.sql.
Inspection baseline (measured on 1.4.0: probe id=1, all three index states t, dead tuples 0%, and hnsw_idx's idx_scan staying close to 0 over time—the last one is exactly the normal phenomenon from Pitfall 5; counters only grow, so go by your own environment for the specific values, see Figure 9):
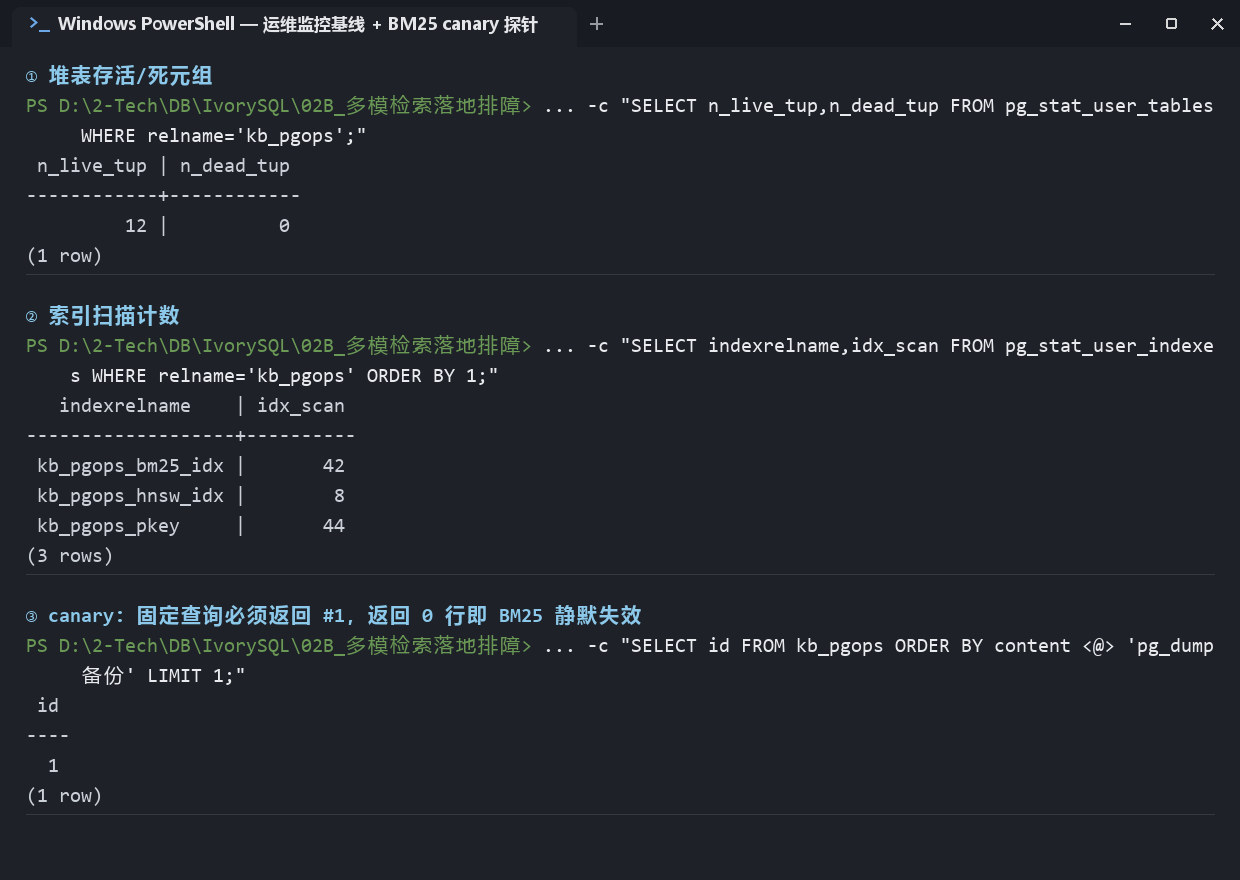
Figure 9: Inspection baseline (corresponds to sql/01_canary_probe.sql + sql/03_monitor.sql)
Recovery (effective on 0.x)—REINDEX (completes in seconds at this data size):
docker exec ivorysql-ts140 psql -U ivorysql -d ivorysql -p 5432 -c \
  "REINDEX INDEX kb_pgops_bm25_idx;"
-- Expected NOTICE: BM25 index build completed: 12 documents, avg_length=11.75
In production use REINDEX INDEX CONCURRENTLY to avoid holding locks for a long time.
One measured conclusion along the way: there is no VACUUM INDEX syntax (it errors out). BM25 is a custom access method, so maintenance is done through table-level VACUUM/autovacuum and rebuilding through REINDEX [CONCURRENTLY].
Two Lessons (They Do Not Expire with Versions)
-
Index health cannot be judged by indisvalid alone. The system catalog saying it is alive does not mean it computes correctly. Probes are mandatory.
-
The two paths have different failure modes, so monitoring must cover them separately: if the standalone BM25 path breaks → "you cannot find anything" (easy to notice); if the hybrid path breaks → "scores change quietly" (more dangerous, and no one gets alerted).
All numbers in this article come from measurements in the ivorysql-ts140 container (IvorySQL 5.4 + pg_textsearch 1.4.0 + pgvector 0.8.5); the most recent collection date is 2026-09-14. Phenomena specific to 0.6.1 have been gathered in Appendix D and annotated.
The 8 accompanying SQL scripts and 9 figures were all fully executed/captured successfully in that environment; reproduction steps are in Appendix C.
Glossary
| Term | Meaning |
|---|---|
| gold (ground-truth answer set) | In information retrieval evaluation, the human-annotated set of "correct documents that a given query should hit". This article has 9 gold points labeled across 5 queries (Q2 and Q3 contain 3 relevant documents each, and the remaining queries 1 each). |
| Top-K | The top K ranked items in the results returned by retrieval. All evaluations in this article use K=5. |
| Recall@K | The number of ground-truth answers hit within the first K results ÷ the total number of ground-truth answers. All 9 gold points across this article's 5 queries were hit = 9/9. |
| Hybrid retrieval | A retrieval approach that obtains results separately from vector semantic recall and BM25 keyword recall and then fuses and ranks them (covered by Pitfall 4 and Appendix A in this article). |
| qrels | The standard relevance judgment file recording "query—document—whether relevant"; external evaluation benchmarks (such as BEIR / MTEB) ship with it. |
| BEIR / MTEB | Public benchmark collections for retrieval / embedding model evaluation; use them as external standard datasets when you want to do a serious capability comparison (see Appendix A). |
Related Posts



Try IvorySQL
Get started with IvorySQL today. Read the docs or try our online demo.